Instrument Selection Principles
Static and Dynamic Characteristics
The selection of instruments requires a high knowledge of our process and operating conditions, infrastructure and power supply, etc ... as well as understanding the different characteristics of a specific instrument.
This article describes the static and dynamic characteristics of instruments in general. It allows you to understand the difference between the different concepts related to the specification of an instrument, online analyzer or sensor.
Knowing the meaning of each of these parameters or characteristics allows us to compare the performance of different instruments when we want to select one of them to perform a certain function.
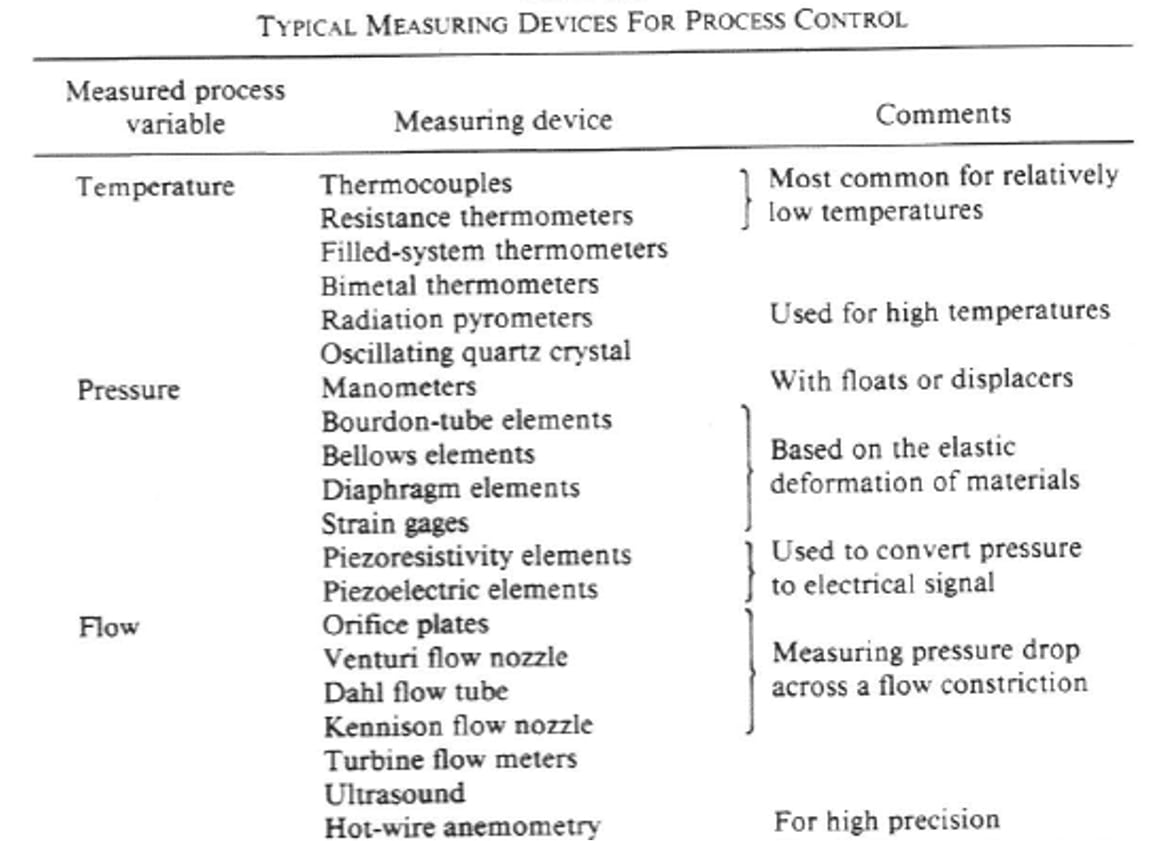
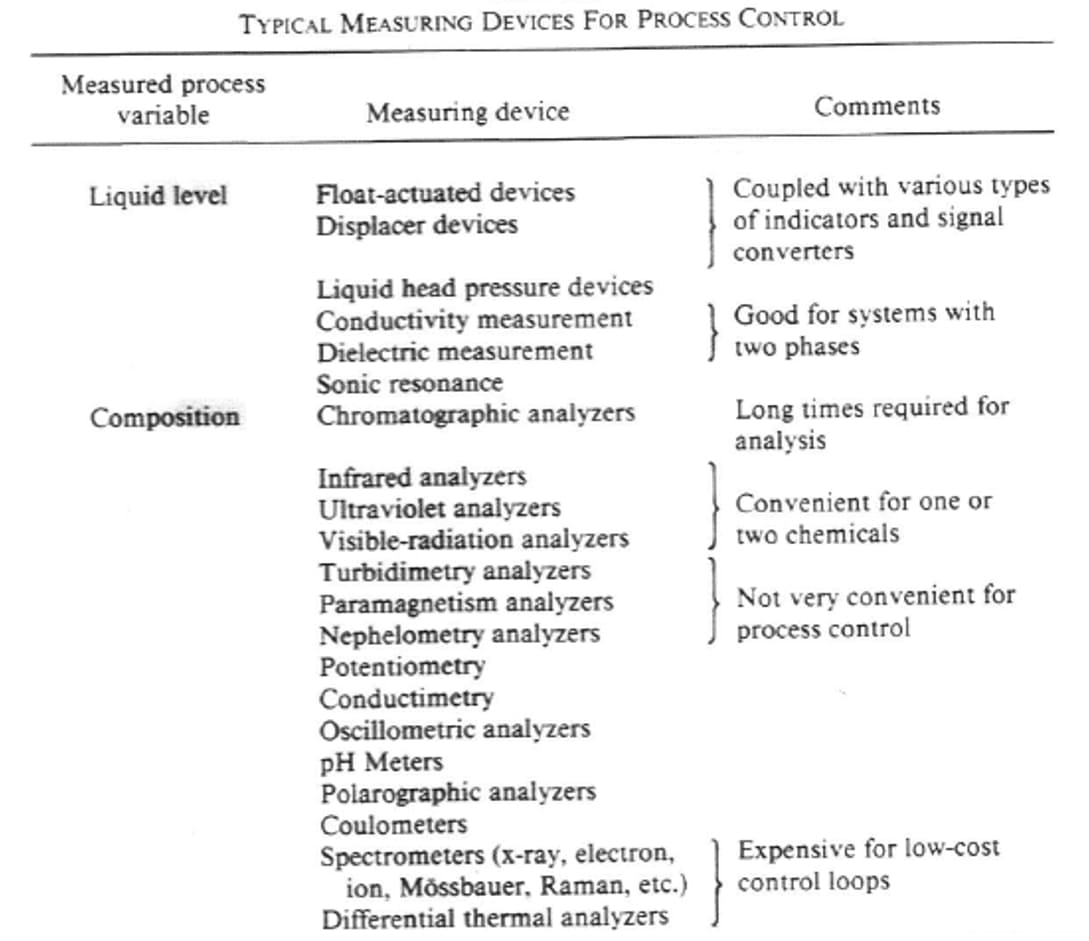
1. Typical control system measurements
1.1 Basic Static Characteristics
1.1.1 Accuracy and Precision
Accuracy indicates how close the measurement is to the true results.
The Precision indicates how close the measurement is to the repeatability or reproducibility values.
Precision defines the limits of possible errors due to the instrument operating at design conditions.
It is possible to find PDS that do not define precision but do define repeatability and reproducibility.

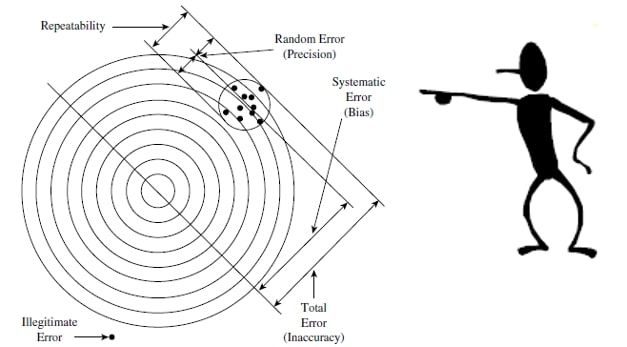
An instrument can be accurate but not precise, precise but not accurate, accurate and precise or inaccurate and imprecise.
If we take note of the value of the different shots on the target in the image we will obtain the following Gaussian bell:
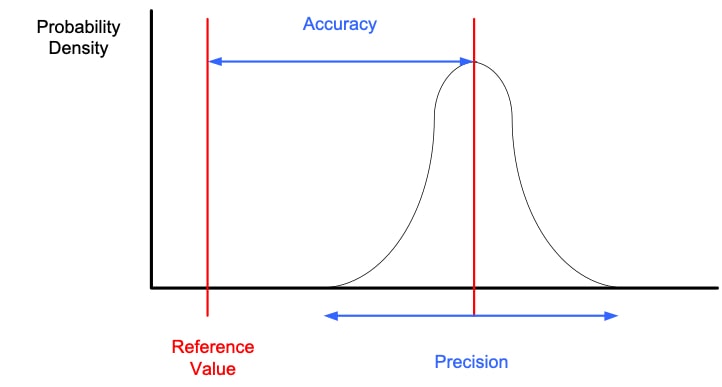
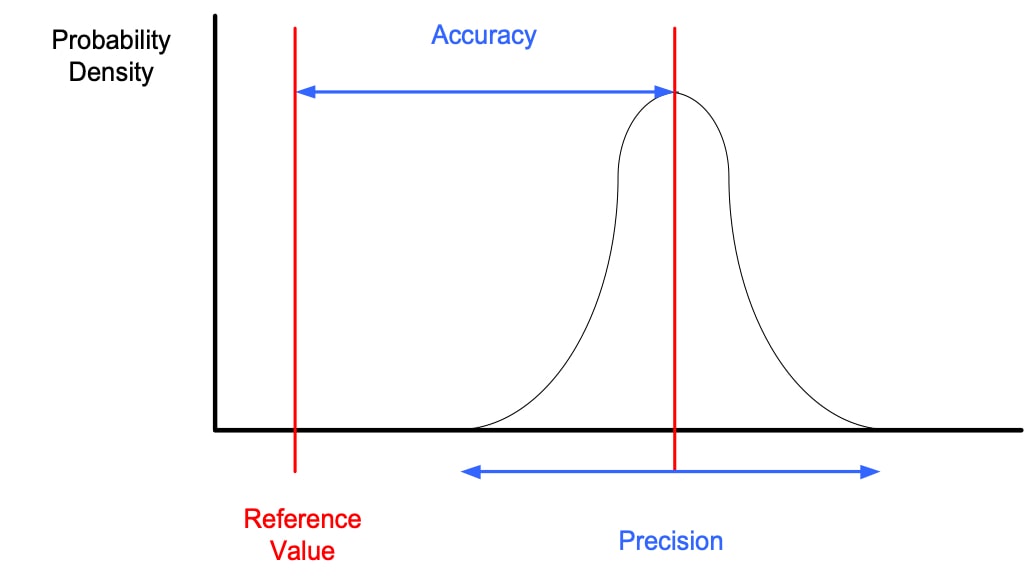
The smaller the distance of the mean value of the normal distribution from the true value, the more accurate the instrument will be.
The smaller the dispersion of the measurements, the more precise the instrument will be.
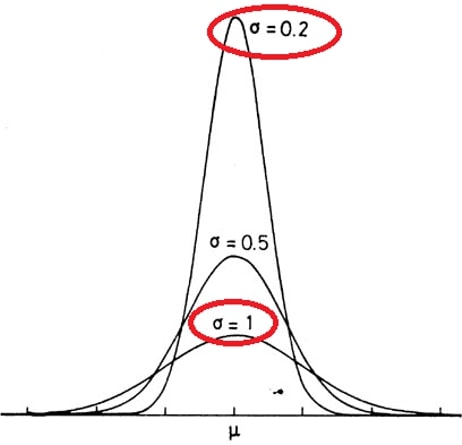
The term precision is used to describe the degree of freedom of a measuring system from random errors.
A high precision instrument will give a low dispersion in the results obtained when making measurements on the same standard. A low precision instrument will give a high dispersion in the results obtained when making measurements on the same standard.


When the accuracy of an instrument is said to be 1±% it is assumed that this value refers to the actual value. If the instrument is reading 100, the actual value must be 99 or 101, but normally the accuracy of an instrument is not expressed as a function of the actual value.
Some manufacturers express a percentage of inaccuracy (error) a function of:
- Percentage of the entire scale.
- Percentage of range.
- Percentage of the upper range value (URV).
Different factors may be added in the calculation of the final accuracy.
1.1.2. Repeatability and Reproducibility
The terms repeatability and reproducibility are ways of expressing accuracy in specific contexts.

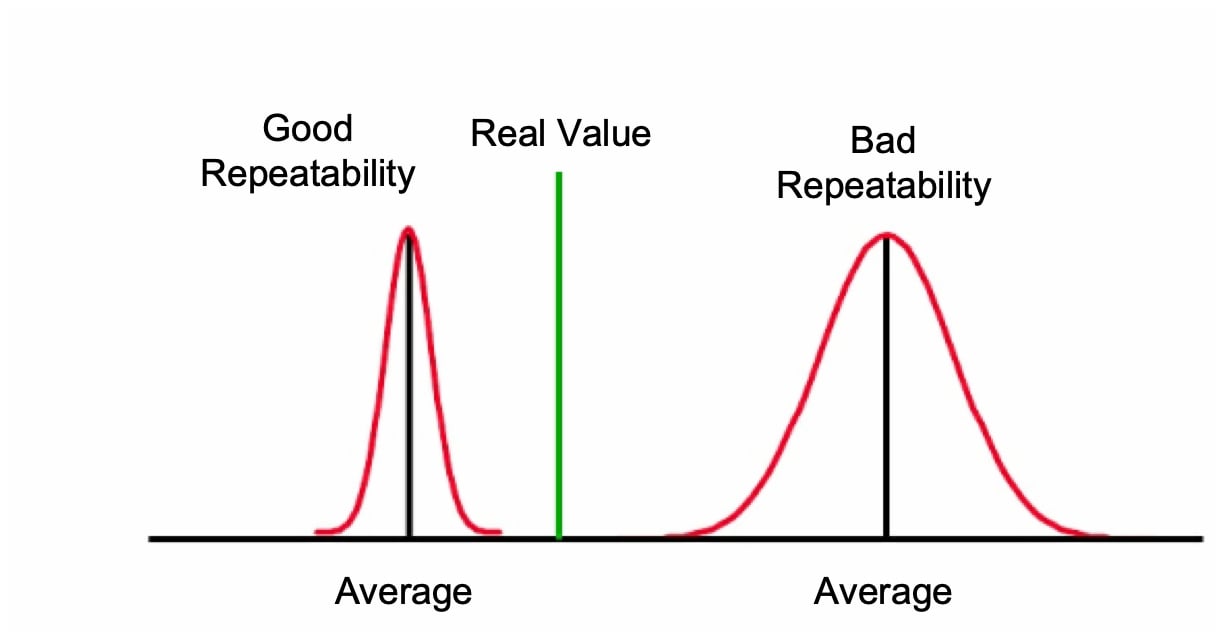
The repeatability of an instrument is the ability to reproduce the same results by repeatedly measuring identical values under the same operating conditions (P, T, Humidity, etc.), same direction of variation and over a defined period of time.
Variation of successive measurements of the same sample, under the same conditions, made by the same instrument. It is preferable to have an instrument with high repeatability and low accuracy than an instrument with high accuracy and low repeatability.
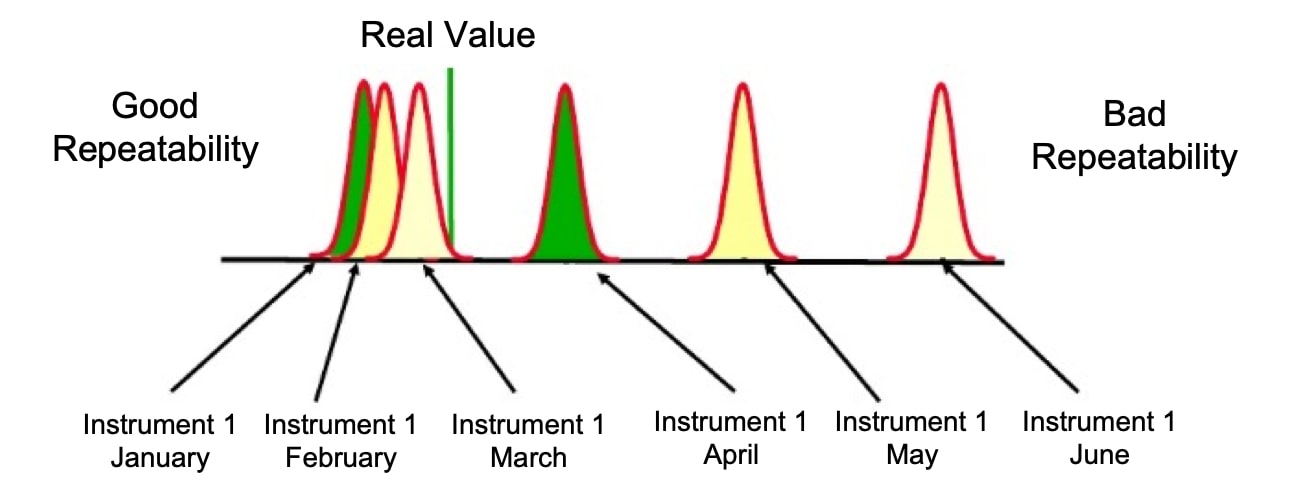
The reproducibility (or stability) of an instrument is the ability to repeat the same results when the measurement is made under different operating conditions (P, T, Humidity, etc.), over long periods of time between different measurements.
1.1.3. Range and Span
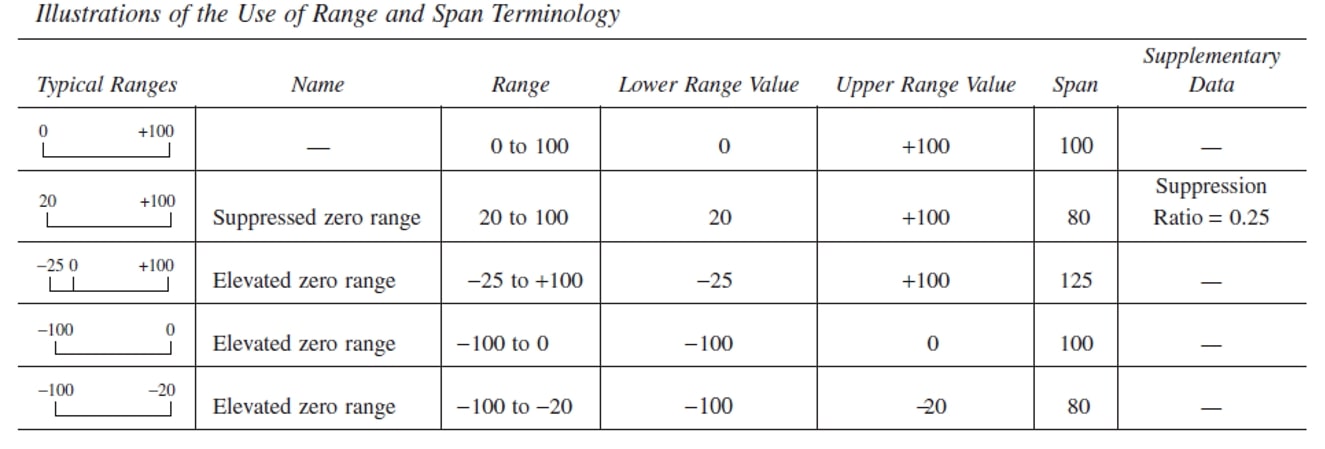
The Range represents the set of values of the measured variable that fall within the upper and lower limits of the instrument's measurement capability. It is expressed with two limits (lower and upper).
The algebraic difference between the upper and lower values of an instrument's range is known as Span. The Span is expressed as a single value.
RANGEABILITY (TURNDOWN O RANGEDOWN):
La rangeability (turndown o rangedown) is one of the most important characteristics of an instrument, it is defined as the ratio between the maximum allowed span with respect to the minimum possible span for a given instrument.
For example, suppose we have a pressure transmitter that has a maximum span of 0 to 55.2 bar and a rangedown of 20 to 1. This means that a technician could set the span somewhere between 55.2 and 2.76 bar.
This information is important for selecting the right transmitter for each application, as the probability of finding a transmitter with the required span is very low.
The turndown tells us about the instrument's ability to adjust its span. The higher the turndown, the lower the sensitivity to low span.
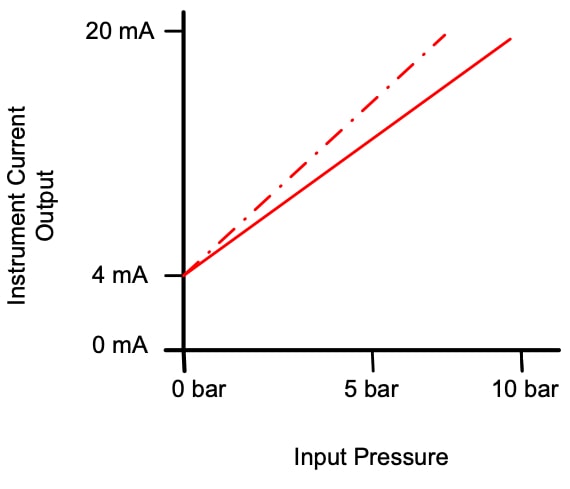
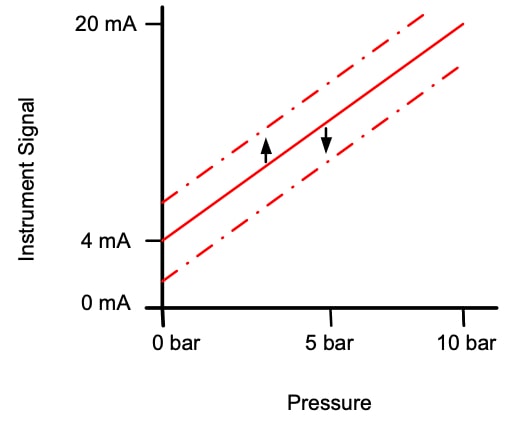
A span offset error due to poor calibration causes the slope of the function to vary.
This error affects unevenly at different values or points across the range of the instrument.

1.1.4. Linearity
Linearity is defined as the closeness of the instrument output curve to a straight line. It is usually measured as no-linearity and expressed as linearity, i.e. maximum deviation between the mean curve and the straight line.
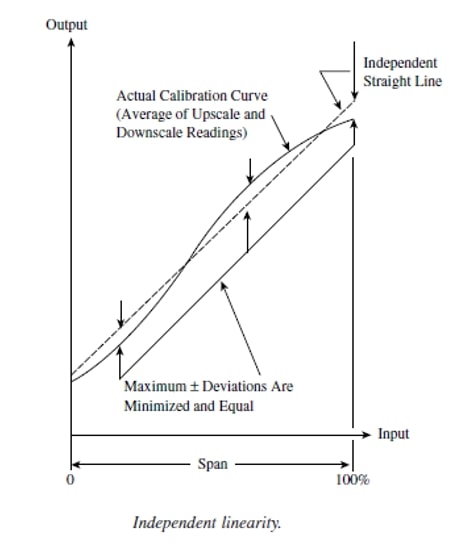
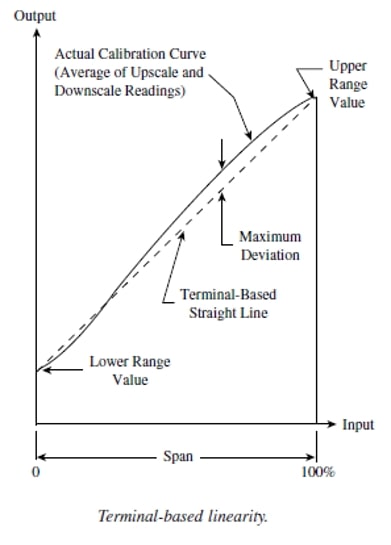
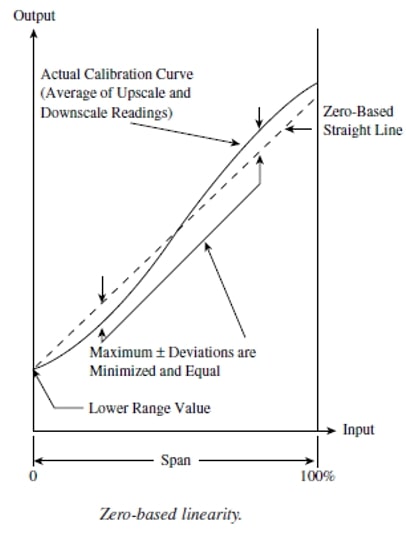
Two variables or magnitudes are in a linear relationship when, keeping the rest of the variables constant, the increase or decrease of one of them implies a proportional increase or decrease in the other so that their quotient is constant.
For example, the acceleration of a mass is in a linear relationship with the force because the equation that links the two is f=m*a, so that if we keep m constant, and the force is multiplied by k, then the acceleration is also multiplied by k.
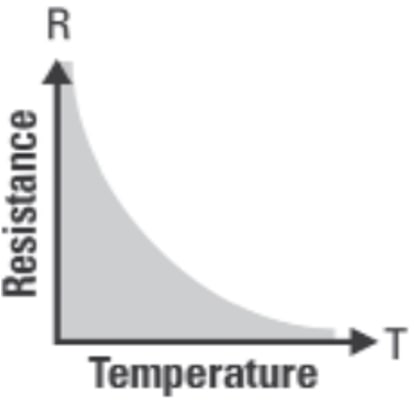
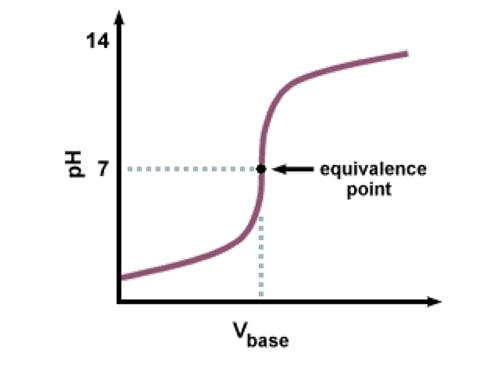
A non-linear relationship is any relationship that does not comply with the above, e.g. inverse, quadratic, exponential. It may affect the nature of the measurement (pH) or the transducer (thermistor).
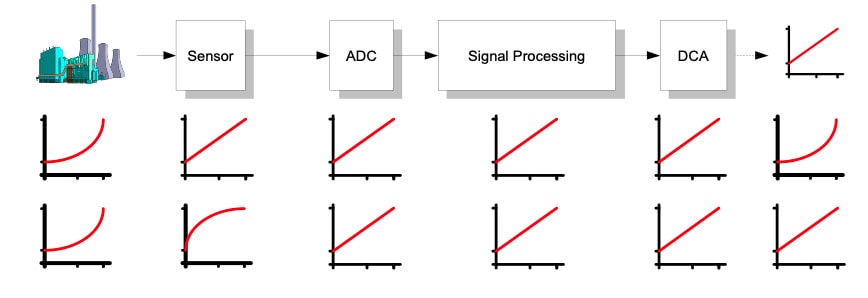
It is normally desirable for the output of an instrument to be proportional to the measured quantity. Although this depends on the nature of the measurement as well as on each and every one of the elements that make up the instrument, it is sufficient for only one of them to be non-linear for the overall response to be non-linear.
1.1.5. Sensitivity
The sensitivity of a measurement corresponds to the slope of the straight line. It is the ratio between the increase of the instrument output magnitude with respect to a change in the input (measured variable) after having reached the steady state.
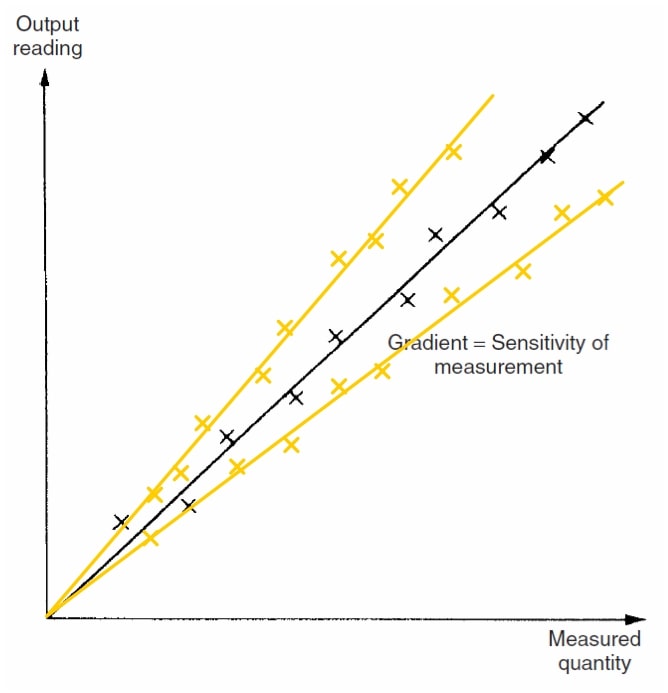
All calibrations / specifications of an instrument are only valid under certain conditions of temperature, pressure etc.
Within our instrument the definition of sensitivity corresponds to the static gain of the sensor.

It is expressed as the ratio with the units of measurement of the two magnitudes, as we have seen this ratio must be constant throughout the range in a linear instrument, for example the iron-constantan thermocouple has a sensitivity at 0oC of 0.05mV/oC; a pressure transmitter has a sensitivity of 0.01159mA/mbar.
SENSITIVITY TO SHOCKS
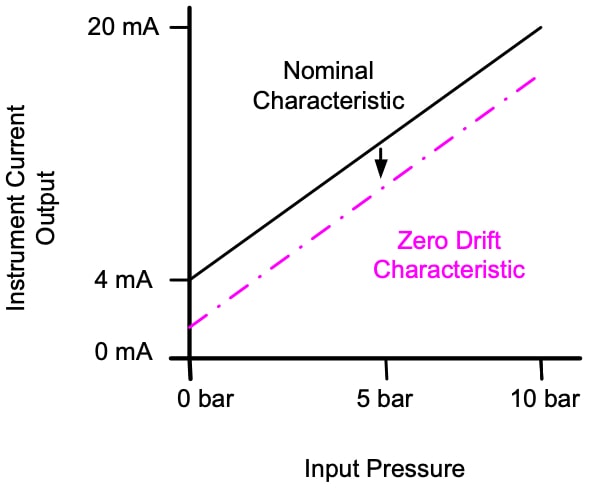
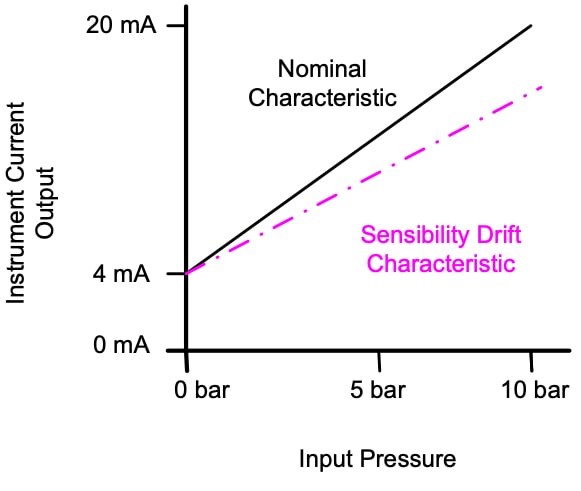
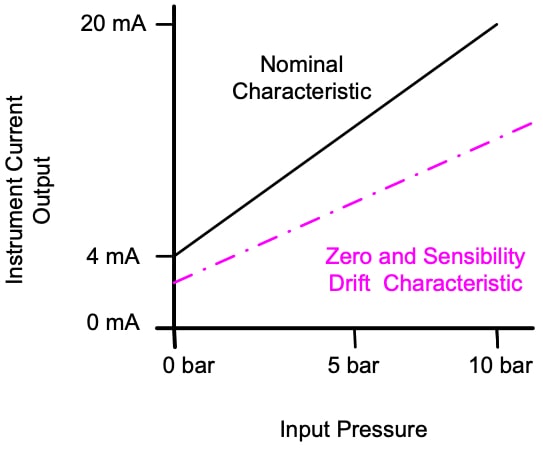
This feature also defines how environmental changes affect the instrument. These changes affect in two possible ways zero drift and sensitivity drift.
- Zero Drift: causes a constant error that exists over the entire range of the instrument, e.g. DC based measurements.
- Sensitivity Drift (Scale Factor Drift): defined as the variation with respect to a unit change in each environmental variable (pressure, temperature,...) that affects the instrument.
Many components of an instrument are affected by fluctuations in the environment, such as temperature.
1.1.6. Hysteresis and Dead Band
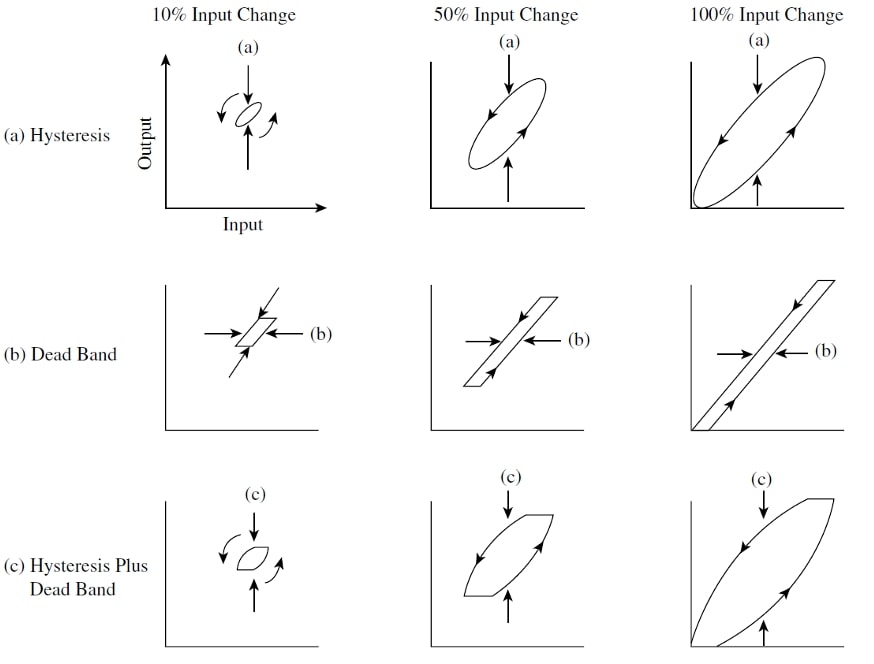
The following figure illustrates the characteristic output of an instrument with hysteresis.

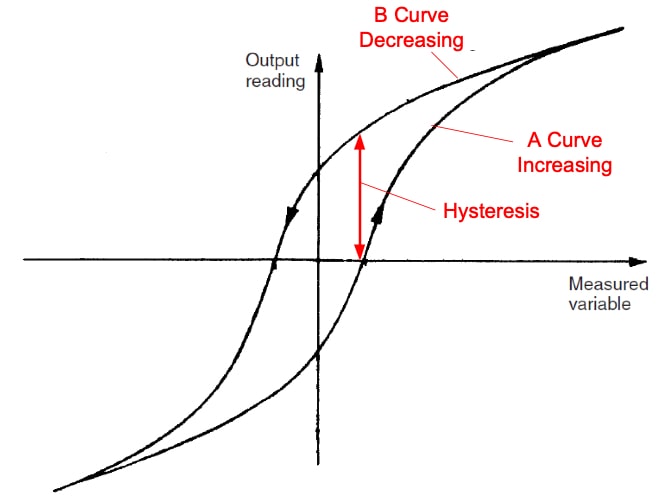
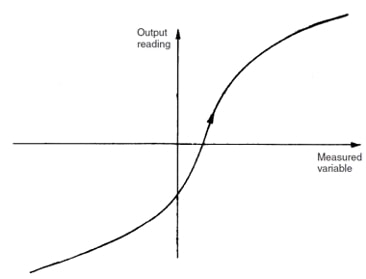
If the measured quantity is increased uniformly from a negative value, the instrument output shows a response similar to the A-curve.
If the measured quantity is then decremented in a uniform way, the output of the instrument shows a response similar to curve B.
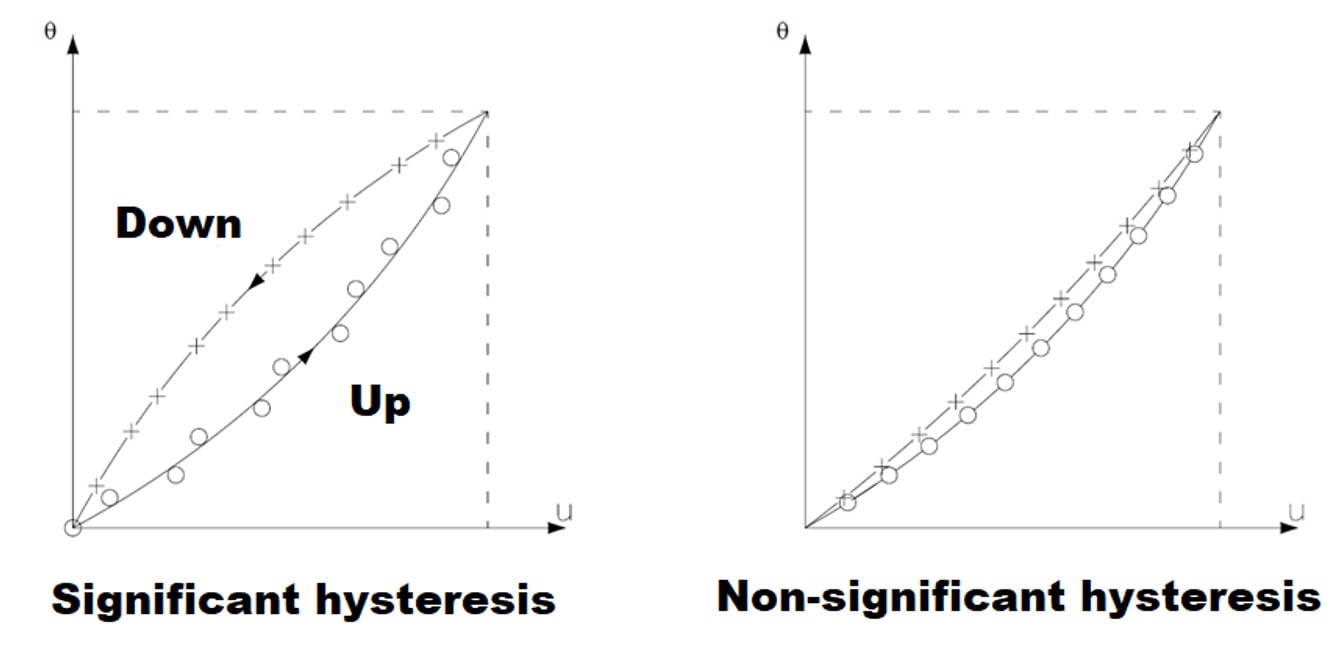
The non-coincidence between these two curves (A,B) is called hysteresis.
Dead band is defined as the range of different measurements over which there is no change in the instrument output, the instrument is dead.
Instruments that do not undergo a certain hysteresis can have a dead band, very typical in instruments where there are gear sets. It is related to the dynamic parameter 'Dead time'.
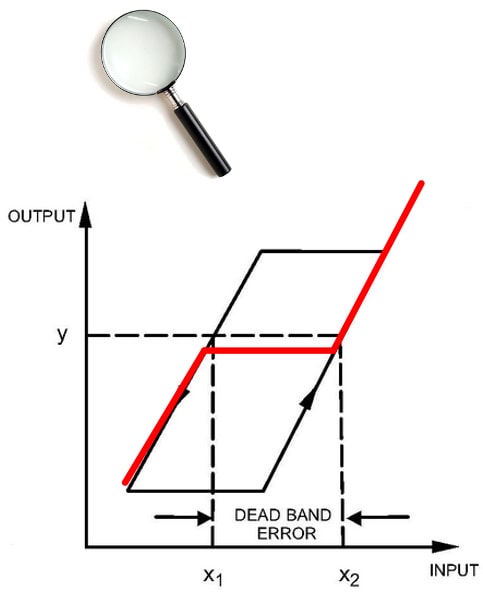
The difference between hysteresis and dead band is that hysteresis always generates a change in the output of the instrument.
1.2 Basic Dynamic Characteristics
Instruments do not respond instantaneously to a change in measurement. The dynamic characteristics of an instrument describe the behavior between the time a change in measurement occurs until the output of the instrument returns to stationary.
The dynamic response of an instrument is characterized by its natural frequency, frequency response, phase shift, linearity and distortions, rise and settling times, response speed...
It will depend on:
- Type of change in the measure.
- Transducer type (instrument).
- Initial conditions.
- System features.

The dynamic response can be linear or nonlinear. Fortunately most instruments show linear characteristics reducing to a simple model using differential equations.

In a linear system we can establish the following differential equation between input and output for a time > 0.

Where : qi is the measured quantity, q0 is the output of the instrument and a0..an,b0..bn are constants.
Simplifying and taking into consideration that the variations of the measured variable are gradual (small increments), we can reduce the differential equation to the following expression :

We can establish three types of responses:
- Zero order response
- First order response
- Second order response
1.2.1 Response Zero Order Instrument
Having the above equation:

If all coefficients a1..an are 0 except a0, then the equation becomes : where K is a constant corresponding to the previously defined sensitivity of the instrument.

Any instrument that behaves according to this equation is called a zero-order instrument.
They are rare instruments, they are not dependent on the input frequency.
An example of this type of instrument can be the resistance measurement of a potentiometer.
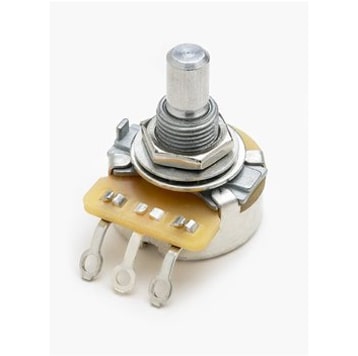
All the instruments behave as a 0-order instrument in the face of small variations in the measured variable.
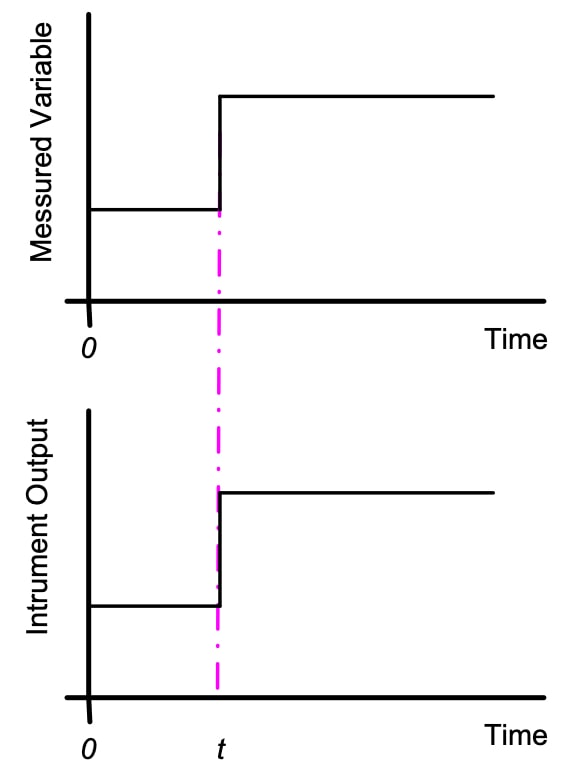
A change in the measured variable at time t generates a change in the instrument output simultaneously.
1.2.2 First Order Instrument Response
Having the above equation:

If all s coefficients a2..an are 0 except a0 and a1, then the equation becomes :

Which corresponds to a 1st order differential equation, substituting d/dt for the operator D and solving for q0 we have :

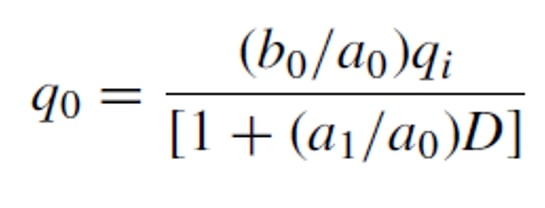
Defining K=b0/a0 as static sensitivity and Tau =a1/a0 as the time constant of the instrument the equation becomes :
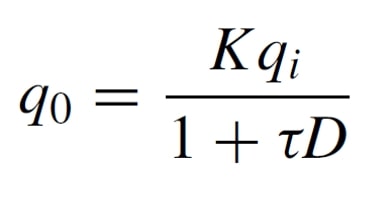
These instruments have a delay in their response, the Tau constant is a measure of the delay.
A large number of instruments have a first order time response, this is important in process control because of the time delay that occurs between the measurement of the quantity and the output of the instrument.
They are characteristic of stable, non-oscillating instruments. Fortunately the time constant is small with respect to the time constant of the process and does not represent a serious problem.
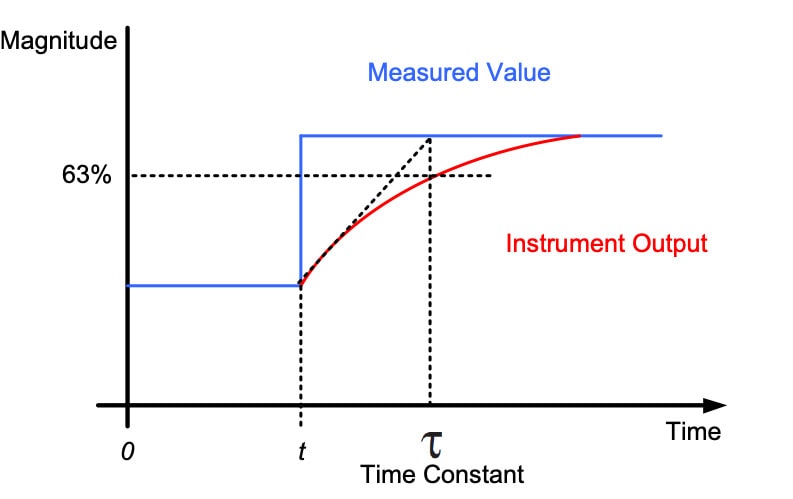
A typical example for this type of instrument is temperature measurement. After a while the output of the instrument tends to equalize to the value of the measured variable, if Tau is large the response of the instrument is slow.
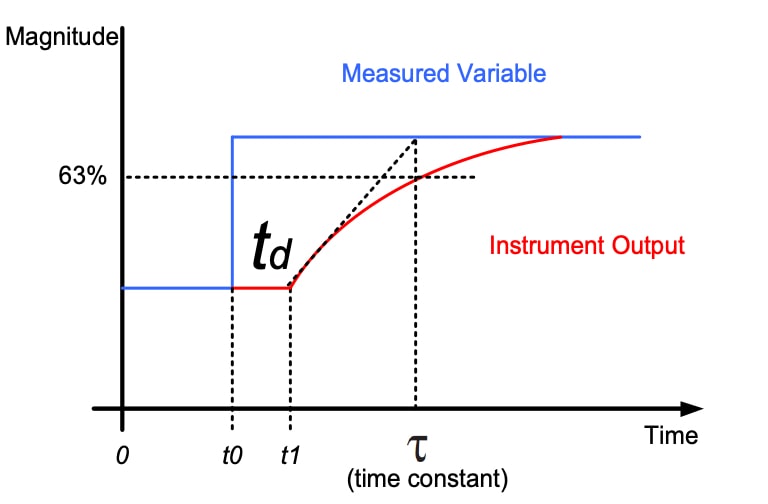
The delay between the time (t0) at which the change in the process variable occurs and the time (t1) at which the sensor starts to detect the change is called dead time.
It is common to find both parameters (dead time and response time) grouped together as Total Response Time.
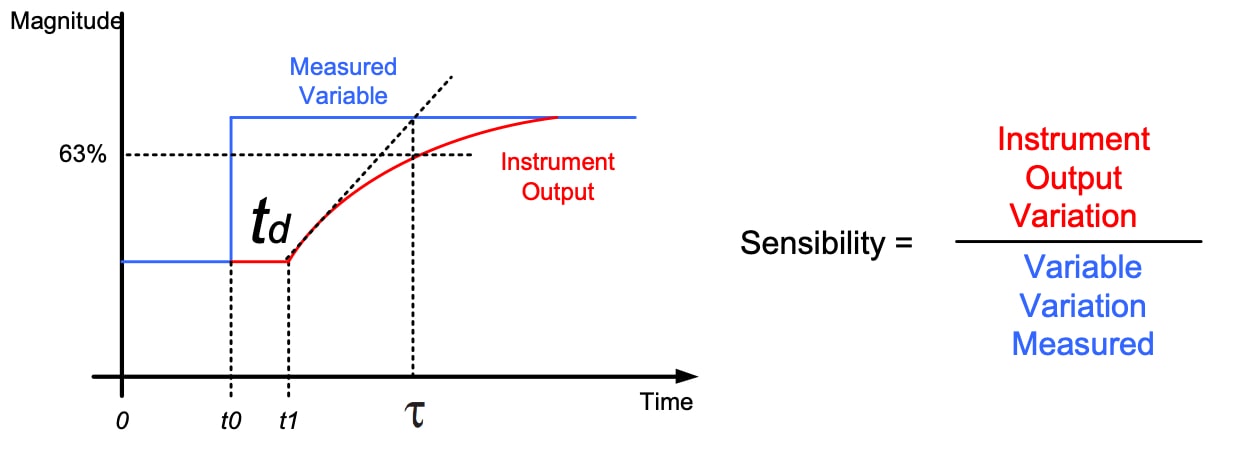
The instrument constants can be determined analytically:
- At time td+tau the output of the instrument has reached 63% of the equilibrium variation.
- The intersection of the tangent line at the inflection point with the equilibrium value of the instrument output is at td+tau.
- The ratio between the variation at the instrument output balance and the amplitude of the step is equal to the static gain or sensitivity of the instrument.
1.2.3 Second Order Instrument Response
Having the above equation:

If all coefficients a3..an are 0 except a0, a1 and a2, then the equation becomes:

Which corresponds to a 2nd order differential equation, substituting d/dt for the operator D and solving for q0 we have:

Defining:

the equation becomes...

Where w is the natural frequency and ep is the damping factor, these values depend on the physical parameters of the equipment, such as the mass and physical dimensions of the sensor.
The shape of the response to a change in measurement depends strongly on the damping factor (epsilon).
The response of this type of instrument is of the stable oscillating type:
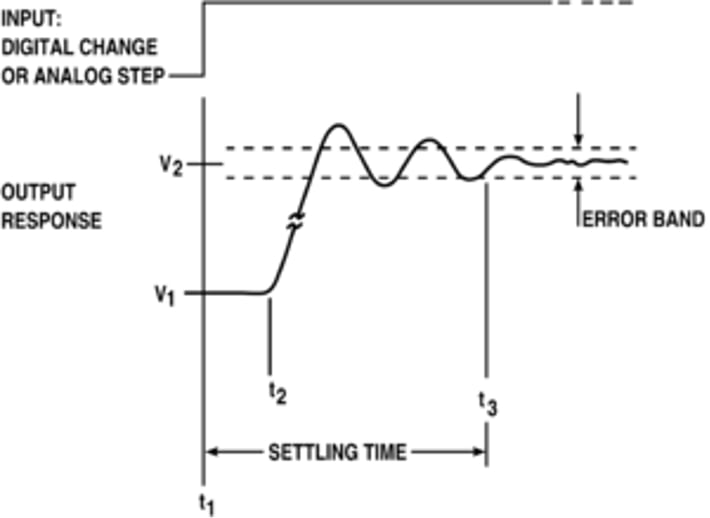
The instrument responds by oscillating to small variations in the measurement (physical/chemical measurement).
The oscillations are reducing in amplitude and after a transient period, they are completely reduced and the process reaches a new stable equilibrium.
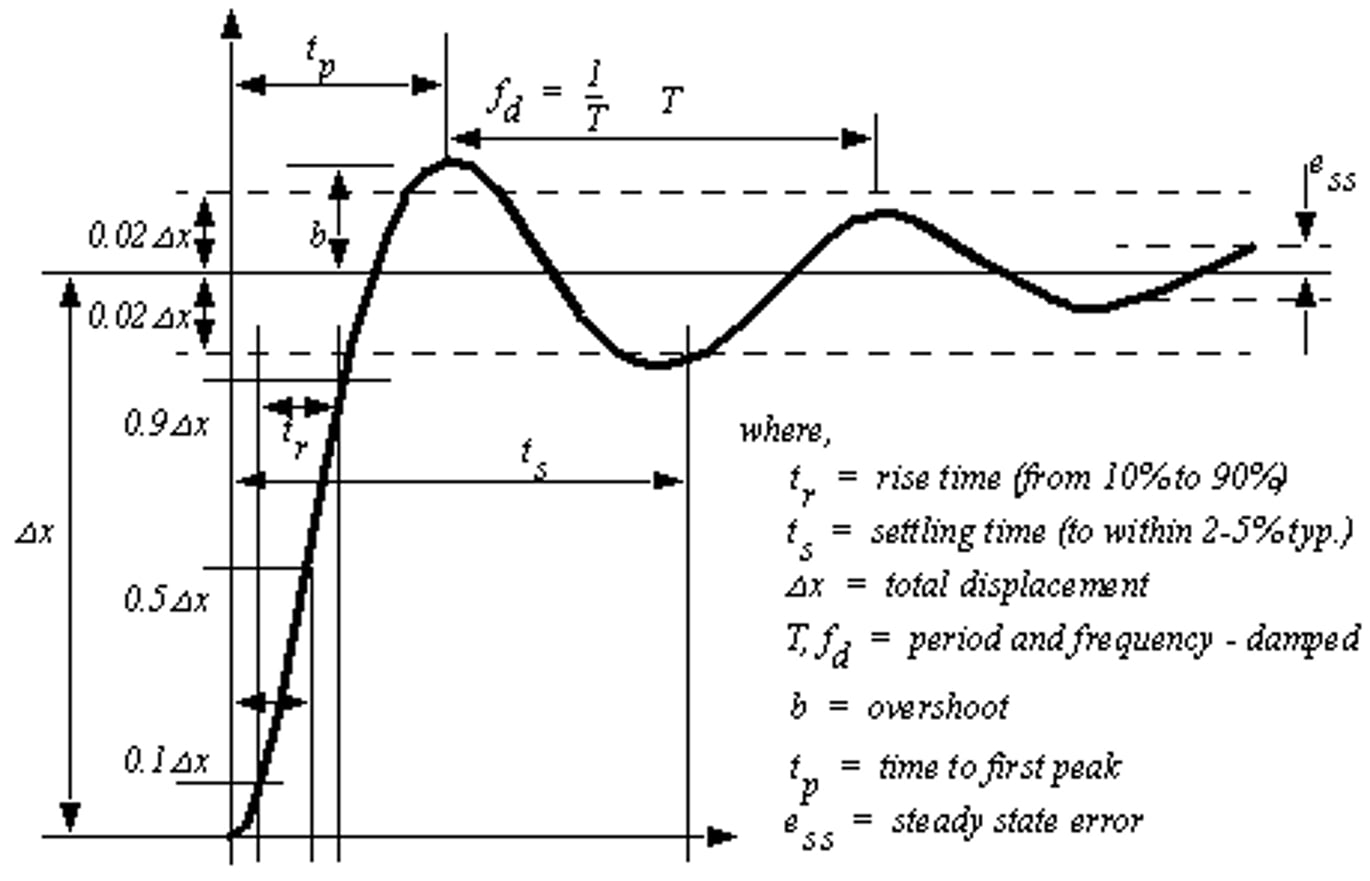
Solving the equation analytically, we observe that the shape of the response depends on the damping factor.
A typical example is the accelerometer where e is usually defined between 0.6 and 0.8.
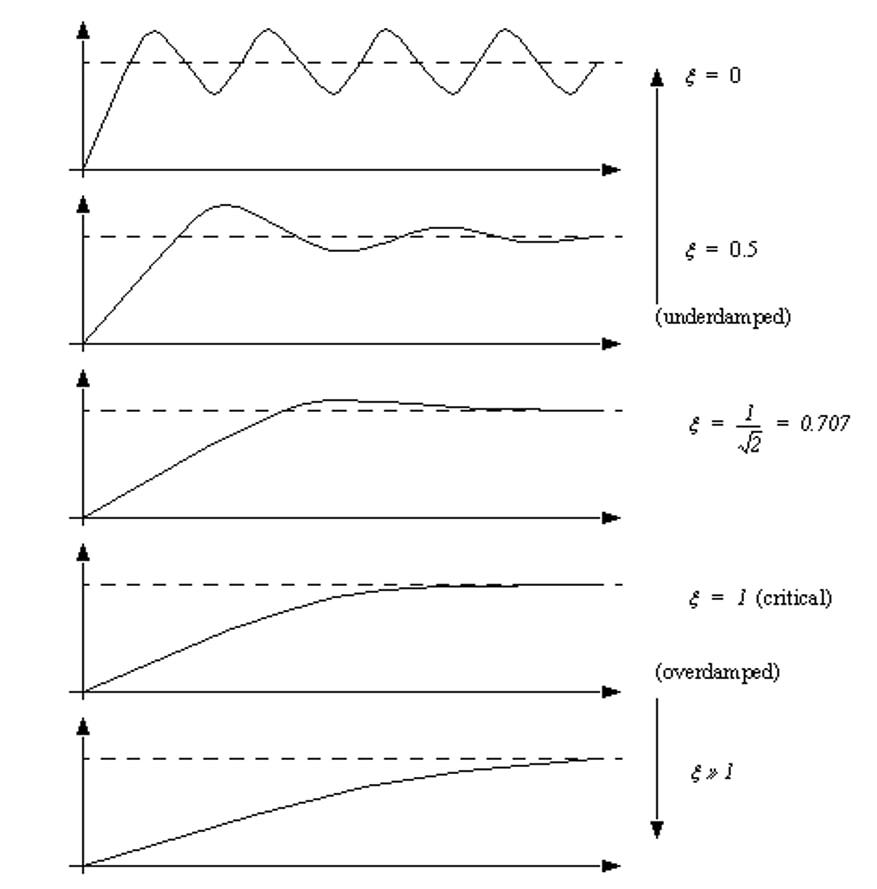
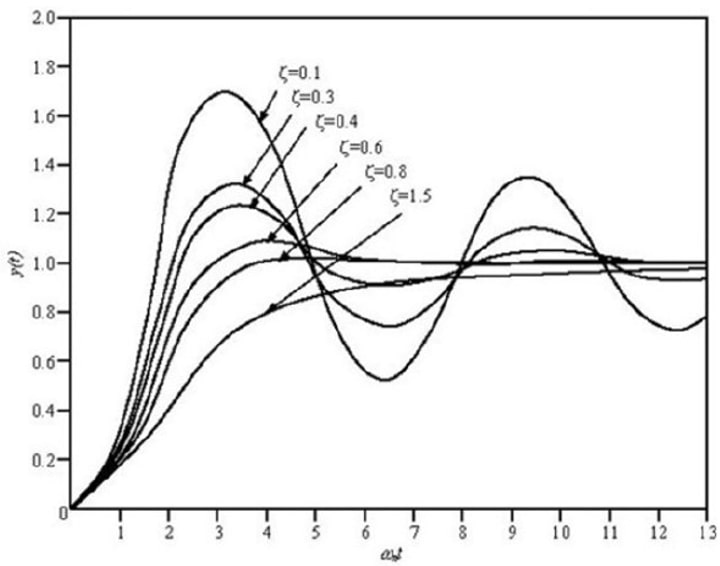
These instruments can oscillate and even be unstable within limits. This means that this type of instrument needs a stabilization time to determine the output.
1.2.4 Response Time
It is defined as the time required for an instrument to respond to a change in the input signal by at least 90% of the expected value. This time is affected by factors such as:
- Analog-to-digital conversion time
- Set up time
- Delays in electronic components
- Sensor delays
In the case of automatic systems, response time can be a limiting factor due to the maximum number of readings that can be taken per second.
2. Calibration - Traceability
When the remote level indicator on a tank reads 90% of its capacity, can you be sure the tank is not overflowing?
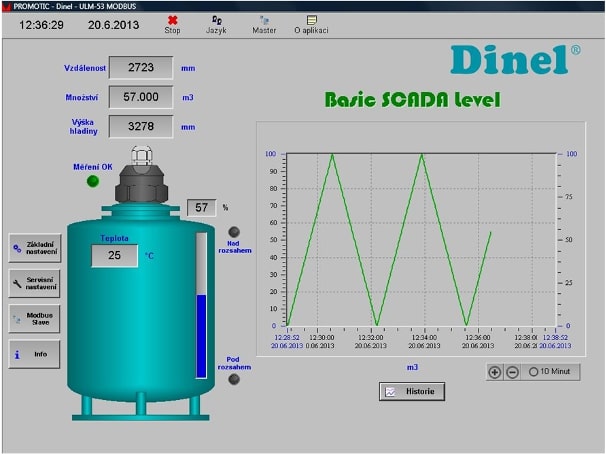
Continuous calibration allows us to ensure that an instrument maintains the specification required by the installation, this must be done periodically.
Calibration consists of comparing the output of an instrument we wish to measure against the output of an instrument of known accuracy when we apply the same input to both instruments.

The calibration of an instrument may change due to zero drift, span drift, or both.
The frequency of calibration depends on the importance of the measurement in the process.
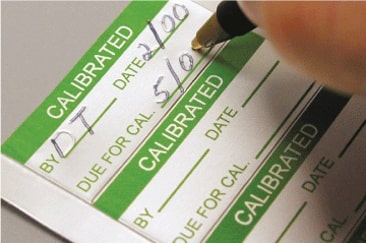
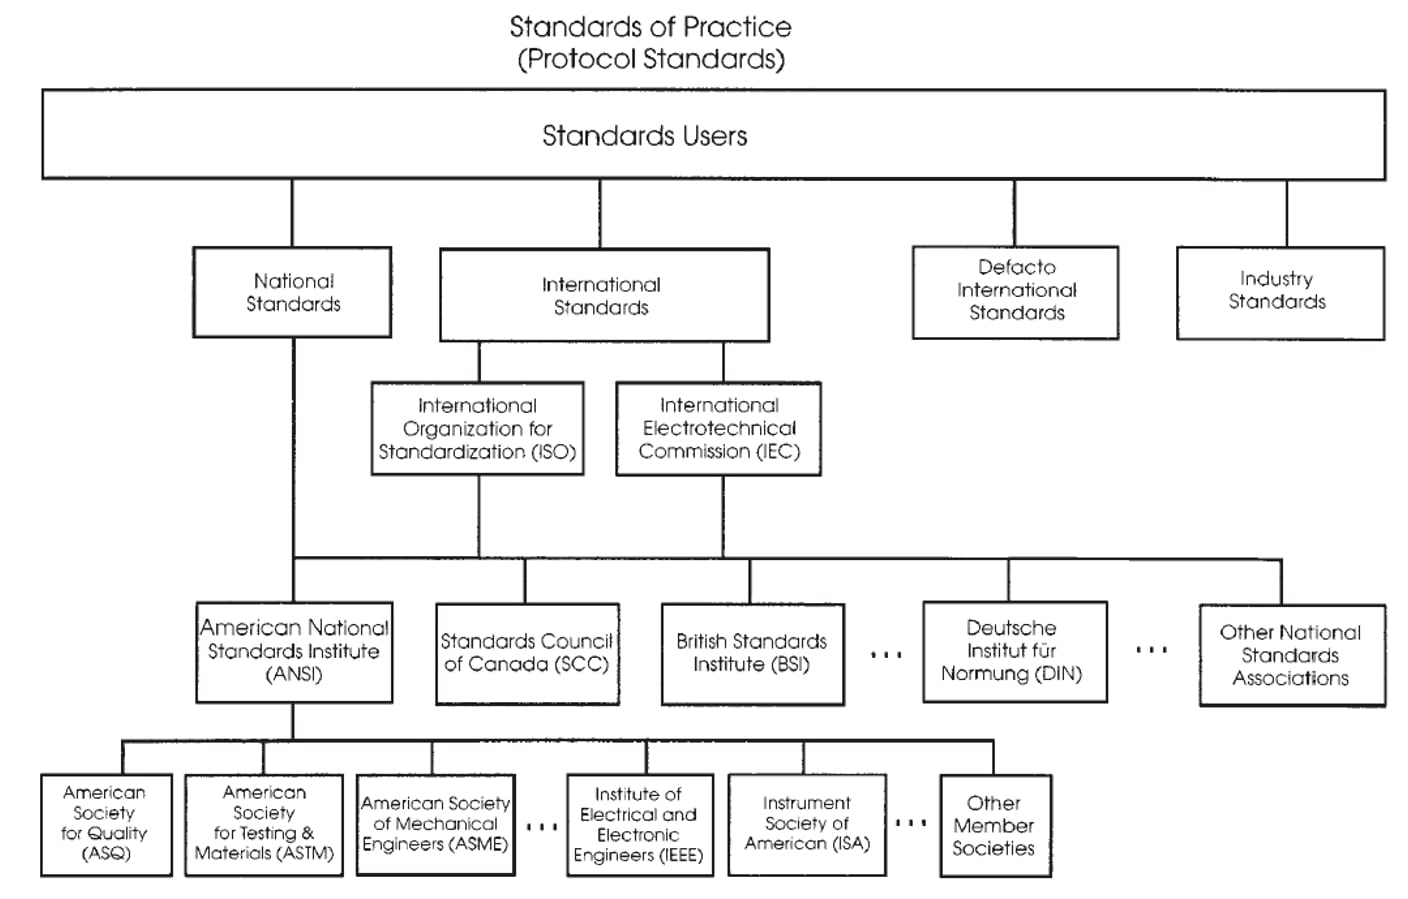
To be valid and acceptable all calibrations must be traceable to a national standard.
Companies usually have 2 basic reasons for performing instrument calibrations:
- Problems related to production.
- Audits, whether quality, environmental or safety audits.
All calibrations must be performed in such a way that they can be checked against a national or international standard (QAL1).
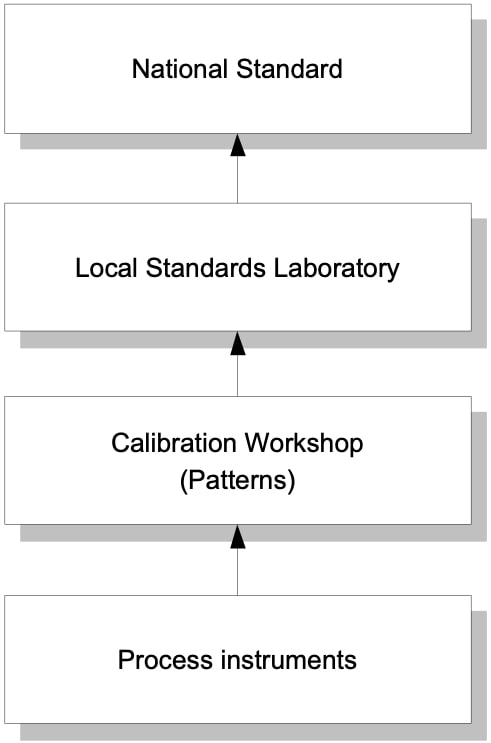
Traceability is achieved by ensuring that the standard elements used are routinely calibrated with a superior reference standard. These instruments are known as standards. They are periodically sent to a standards laboratory to be calibrated with higher accuracy laboratory equipment.
The calibration instrumentation found in the instrumentation departments of companies is the first link in the calibration chain.
Laboratory standards are periodically calibrated with a higher reference standard.
The technician's calibration work to maintain traceability involves ensuring that the standards used by his workshop are within the defined calibration range, that this instrument (standard) is used to perform the calibration of the plant items and that documentation of the calibration performed on the standard instrument by the standards laboratory is available.
They are supposed to maintain their accuracy for a long time because they suffer little deterioration, but this does not exempt them from periodic calibration.
