Scientific Databases
FREE Online Databases
In this category we will find useful tools for the instrumentation engineer, such as the measurement of Normal, Current and Standard flow or the calculation of the amount of product that leaks through a pipe. We will gradually add more tools to this section. The results of all calculators are exportable in spreadsheet format. If you have any questions or require further clarification, do not hesitate to contact us.

Absolute Viscosity of Common Gases Table
Check out our webpage featuring a table of the Absolute Viscosity of Common Gases. This resource provides valuable information for scientists, engineers, and researchers. Don't miss out on the opportunity to enhance your knowledge in this field! This table presents the absolute viscosity of some common fluids and his evolution against the temperature.

Heat Capacity Ratio of Common Fluids Table
Table of specific heats'ratio for common gases. This webpage provides information on the specific heats ratio of common gases, including air, nitrogen, oxygen, and carbon dioxide. Learn how to calculate this important thermodynamic property and why it matters in engineering and physics. Take your understanding of gases to the next level with our helpful guide.
Density of Common Liquids
Looking for information about the density of common liquids? Check out our webpage with a comprehensive table including densities of water, milk, oil, alcohol, and more. Whether you're a student, researcher, or just curious, this resource is a must-see. Don't miss out, visit our webpage today! This table presents the density of some common liquids and his temperature.

Molecular Weight of Common Gases
Looking for a quick reference on the molecular weight of common gases? Check out our webpage featuring a handy table with molecular weights for a variety of gases. From hydrogen to sulfur hexafluoride, our table has got you covered. Use it for research, calculations, or just to satisfy your curiosity. Visit our site now and take advantage of this useful resource!. This table presents the Molecular Weight of Common of Gases, including air, steam and natural gas, and his Formula.
Coefficients of Linear Thermal Expansion
Looking for information on the linear thermal expansion coefficient values for metals and alloys? Check out our comprehensive table, which provides detailed data on the thermal expansion properties of various metals and alloys. Whether you're an engineer, scientist, or student, this resource is a must-have for anyone working with these materials. So why wait? Visit our website today and access the information you need to excel in your field! This table presents the Linear Thermal Expansion Coefficient Values for Metals and Alloys
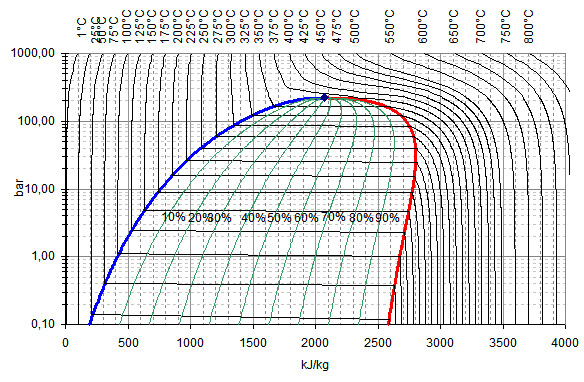
Steam Saturation Properties Table (IAPWS-IF97)
Reference table of steam saturation properties from 0 °C to 370 °C, based on the internationally accepted IAPWS-IF97 standard. Includes saturation pressure, vapor and liquid density, vapor viscosity, heat capacity ratio, and latent heat of vaporization. Essential for steam system design, orifice and valve sizing, and wet steam flow calculations.